This final project was developed in partnership with Datastam and centered on the professional practice of data storytelling: transforming credible data into clear, ethical, audience-centered narratives.
The project required our team to move beyond simply locating datasets or summarizing statistics. Our work focused on interpreting data responsibly, identifying a meaningful story within the evidence, and presenting that story in a way that would be useful to readers who may not have technical expertise.
The final deliverable brings together individual data articles created by each team member. While each article focuses on a different topic, the combined project reflects a shared purpose: to demonstrate how data can be used to clarify complex issues, support informed understanding, and communicate patterns without oversimplifying the people or systems represented by the data. This structure allowed the team to explore a range of issue areas while maintaining common standards for source quality, visual clarity, ethical interpretation, and audience accessibility.
Datastam's emphasis on making data more understandable and actionable shaped how we approached the assignment. We treated the audience as an important design consideration from the beginning, not as an afterthought. For each article, we considered what readers would need to know before interpreting the data, what context would help them understand the issue, and how charts or visuals could support the narrative rather than simply decorate the page. The goal was to create data stories that were readable, focused, and useful.
A key part of the project was narrowing broad topics into manageable, evidence-based stories. Many of the issues addressed in the final deliverable are large, complex, and affected by historical, social, economic, or institutional factors. A responsible data article cannot explain every dimension of those issues in a short format. Because of that, the team worked to identify focused angles that could be supported by available data. This helped prevent the articles from becoming too broad, too descriptive, or too dependent on unsupported claims.
Feedback integration was one of the most important parts of the revision process. Feedback from the instructor, Datastam, peers, and earlier draft review helped the team strengthen both the structure and substance of the final articles. In response to feedback, we refined article focus, clarified main claims, improved transitions between evidence and interpretation, and strengthened the relationship between visuals and written explanation. The revision process helped move the project from a collection of topic summaries toward a more cohesive set of data stories.
The team also used feedback to evaluate whether each article was serving the reader effectively. In several cases, feedback pushed us to add more context before presenting data, explain visuals more clearly, or make the central takeaway easier to identify. This was important because a data story should not require the reader to infer the significance of a chart or statistic on their own. The article should guide the reader through the evidence, explain why it matters, and remain transparent about what the data can and cannot prove.
Data quality was a central concern throughout the project. Before relying on a dataset or source, the team considered whether it was credible, relevant, current enough for the topic, and appropriate for the claim being made. We also considered what each dataset measured, what it did not measure, which populations or time periods were included, and what limitations might affect interpretation. This was especially important because data can appear authoritative even when it is incomplete, outdated, or too narrow to support broad conclusions.
Our team recognized that data quality is not only a technical issue, but also an ethical one. A chart or statistic can shape how readers understand a problem, assign responsibility, or perceive a group of people. Because of this, we worked to avoid overclaiming, implying causation where the data only showed association, or presenting incomplete data as if it represented the full reality of an issue. When the data showed a pattern but did not fully explain why that pattern existed, the writing needed to make that distinction clear.
Ethical storytelling was especially important because many of the topics in the final project involved people, communities, education, public systems, or social outcomes. The team aimed to avoid deficit-based framing, stereotypes, unsupported assumptions, and language that could unintentionally reduce people to data points. Instead, we focused on using data to illuminate conditions, patterns, and barriers while maintaining respect for the people represented in the evidence. This approach helped ensure that the articles were not only accurate, but fair and responsible.
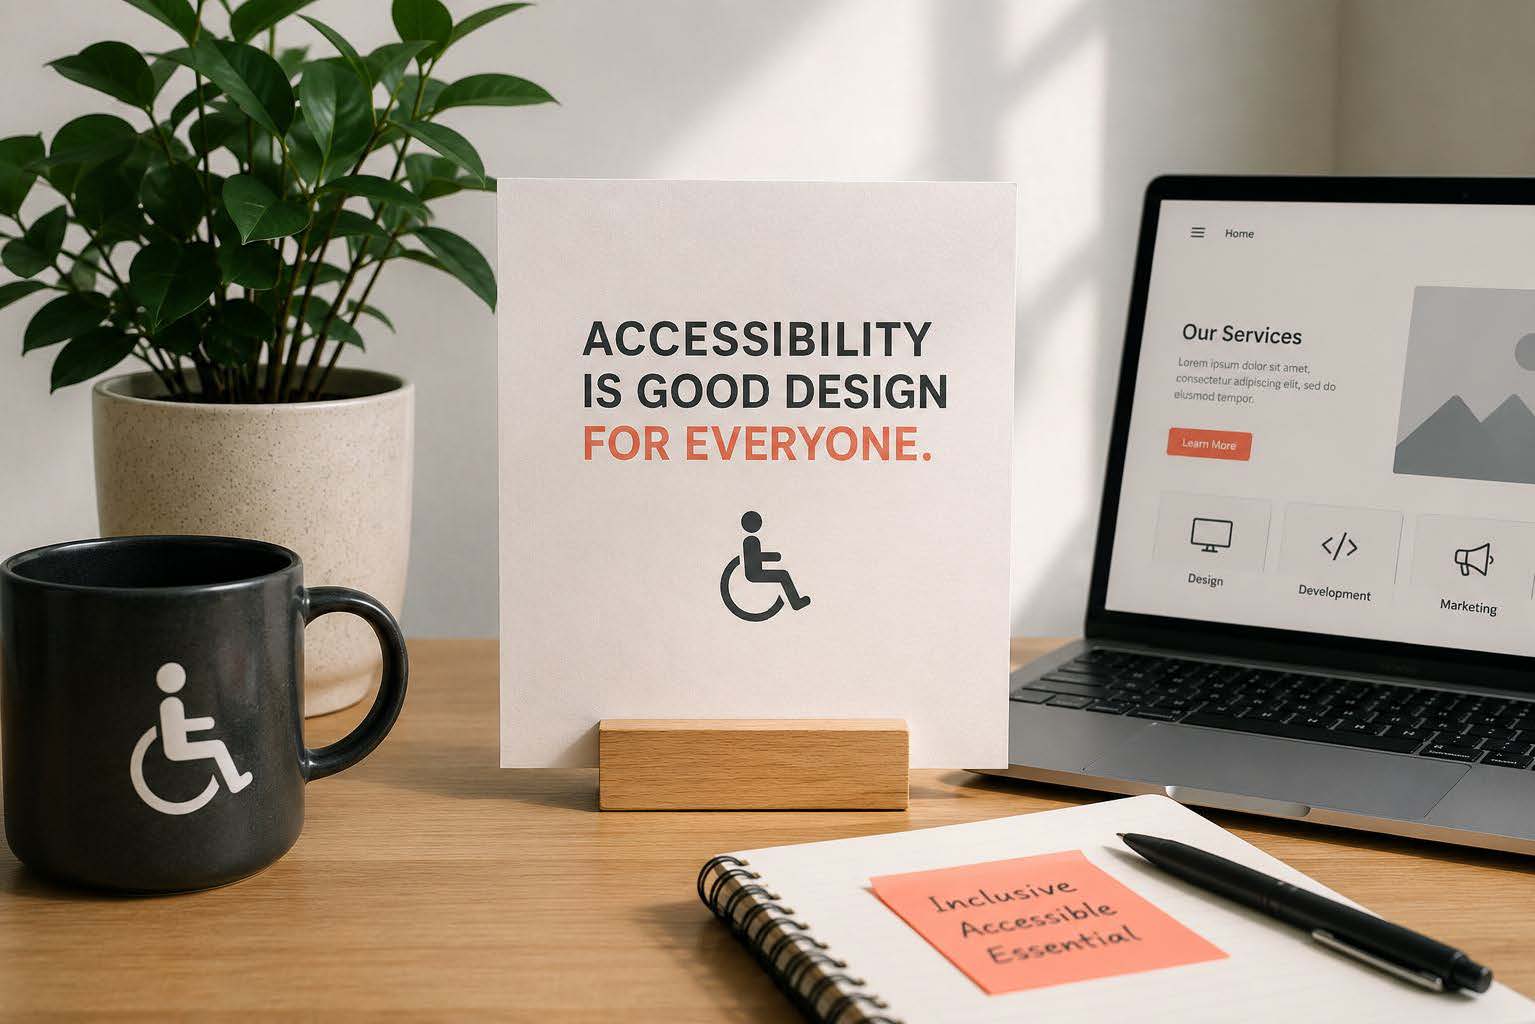
Accessibility also shaped the project's ethical approach. Because the purpose of data storytelling is to make information more understandable, the team considered how writing style, organization, and visual design affect comprehension. We aimed to use plain but professional language, clear headings, readable visuals, and explanations that connected data to meaning. This was particularly important for a client-facing deliverable because the final project needed to communicate effectively beyond the classroom.
Datastam feedback and tool-based review helped the team think more critically about whether the articles worked as data stories. Datastam-related feedback encouraged us to pay attention to audience fit, clarity of the main point, usefulness of visualizations, and whether the narrative made the data easier to understand. The team treated this feedback as part of a professional revision process rather than as a checklist. Suggestions were incorporated when they improved clarity, strengthened the evidence-to-claim connection, or made the article more accessible to readers. When a suggestion did not align with the article's purpose or was not supported by the available data, it was revised or set aside.
The final combined project reflects the team's effort to apply data storytelling as a professional communication practice. The work required analytical judgment, ethical awareness, audience analysis, visual communication, and revision based on feedback. Each article contributes to the larger goal of helping readers understand an issue through evidence while also recognizing the limits of that evidence. As a result, the final deliverable is not simply a set of separate student papers. It is a coordinated collection of data stories designed to support clearer, more responsible public understanding.