Access Is Not
The Same As
The Same As
Inclusion
Why education data must tell the story of friction, not just compliance.
Why education data must tell the story of friction, not just compliance.
For many students with disabilities, the problem is not always that the school door is closed. Sometimes the door is technically open, but the hallway is too narrow, the course site is confusing, the materials do not work with assistive technology, the accommodation arrives after the assignment is due, or the student has to keep proving a need that should have already been anticipated. That is the difference between access and inclusion.
A system can look orderly in a chart and still feel exhausting to the people navigating it.
Access asks whether a student is allowed to enter an educational space. Inclusion asks whether that student can participate, learn, belong, and succeed once there. This distinction matters because education systems often rely on the language of services, placement, and compliance — categories that are necessary, but do not always capture lived experience.
This story is written for educators, school leaders, families, accessibility advocates, and education decision-makers. The audience is intentionally broad because accessibility is not limited to one grade level or one disability services office. It is a core measure of whether education systems are serving the students who are actually in them.
National education data make the scale impossible to dismiss. In 2022–23, 7.5 million students ages 3–21 received special education or related services under the Individuals with Disabilities Education Act, representing 15 percent of public school enrollment (National Center for Education Statistics 2024a). Put plainly, disability accessibility is not a niche concern. It is part of the ordinary structure of American education.
One reason this topic matters is that educational access is often measured through presence. Is the student enrolled? Is the student placed in a general education classroom? Is an accommodation plan documented? Is the policy posted? These are necessary questions, but they are not sufficient. A student can be counted as included and still encounter barriers that make participation harder than it should be.
This is why the guiding question cannot simply be, Do students with disabilities have access? It has to be split into two more precise questions. First, can students with disabilities enter educational spaces? Second, can they fully participate and thrive once they are there? Those are not the same question. The first is about entry. The second is about experience.
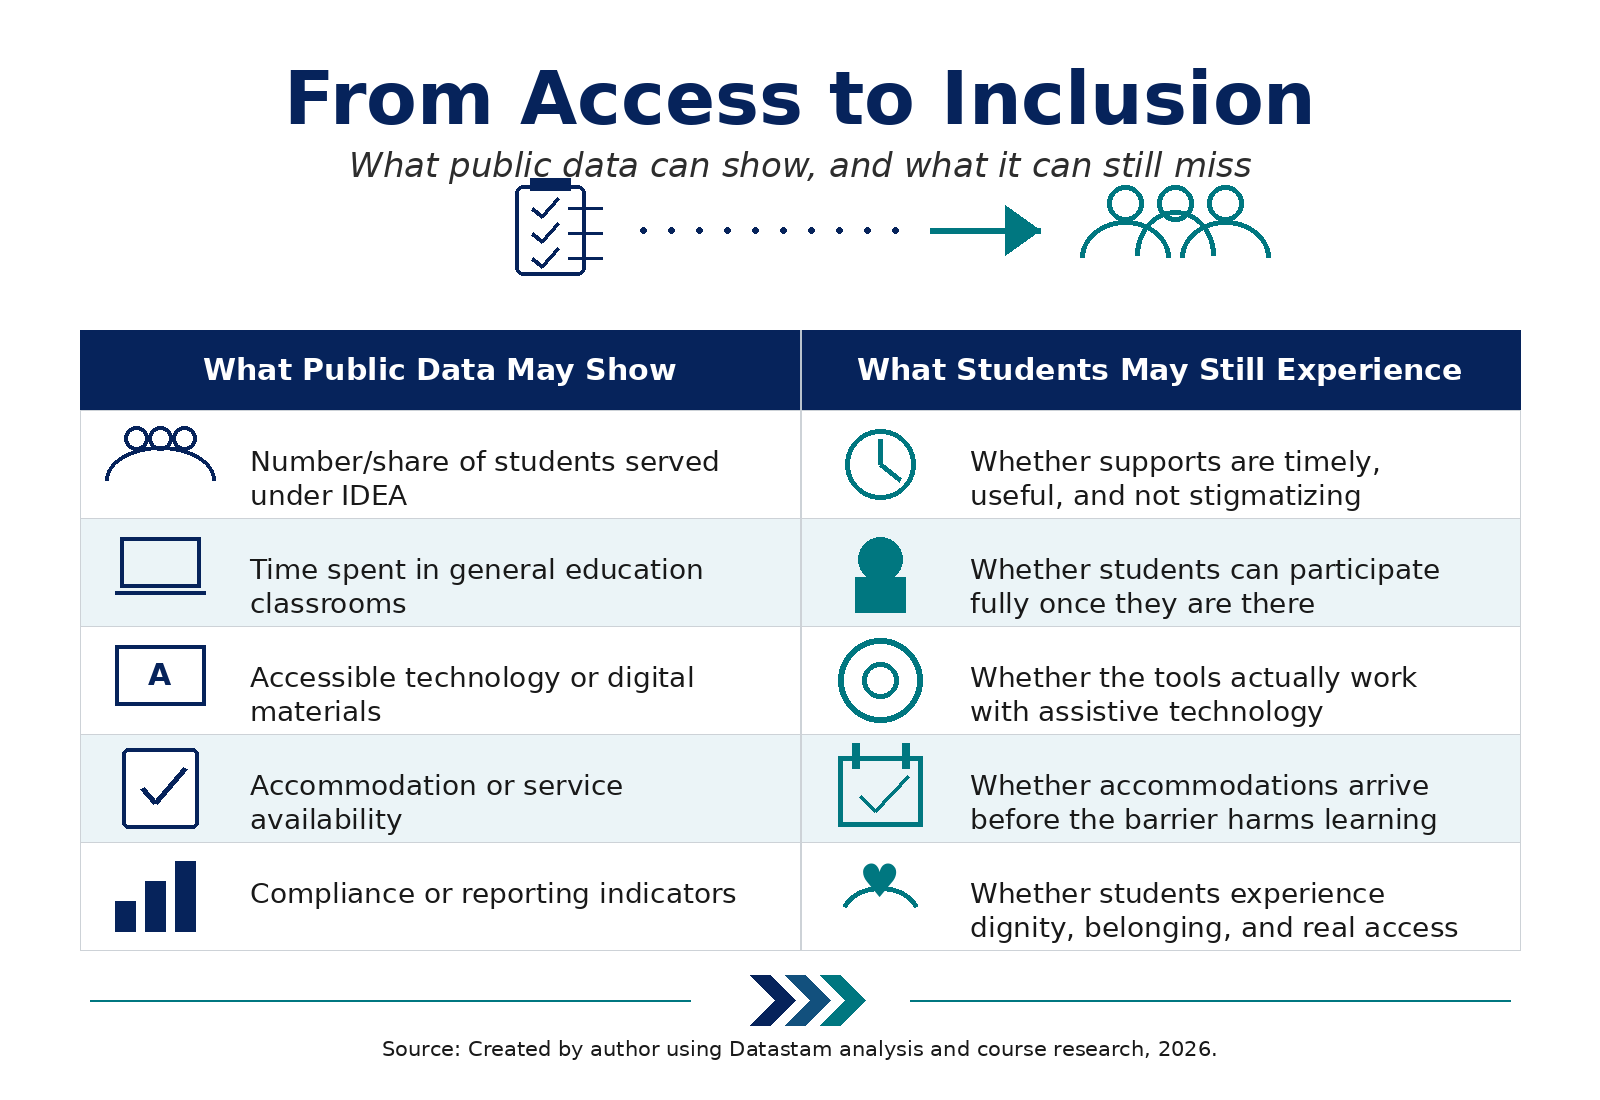
The access-to-inclusion framework helps explain why a single statistic can be useful without being complete. Public data may show the number of students served under IDEA, the time students spend in general education classrooms, or whether schools report access-related indicators. What those measures may still miss is whether supports are timely, usable, dignified, and meaningful in daily school life.
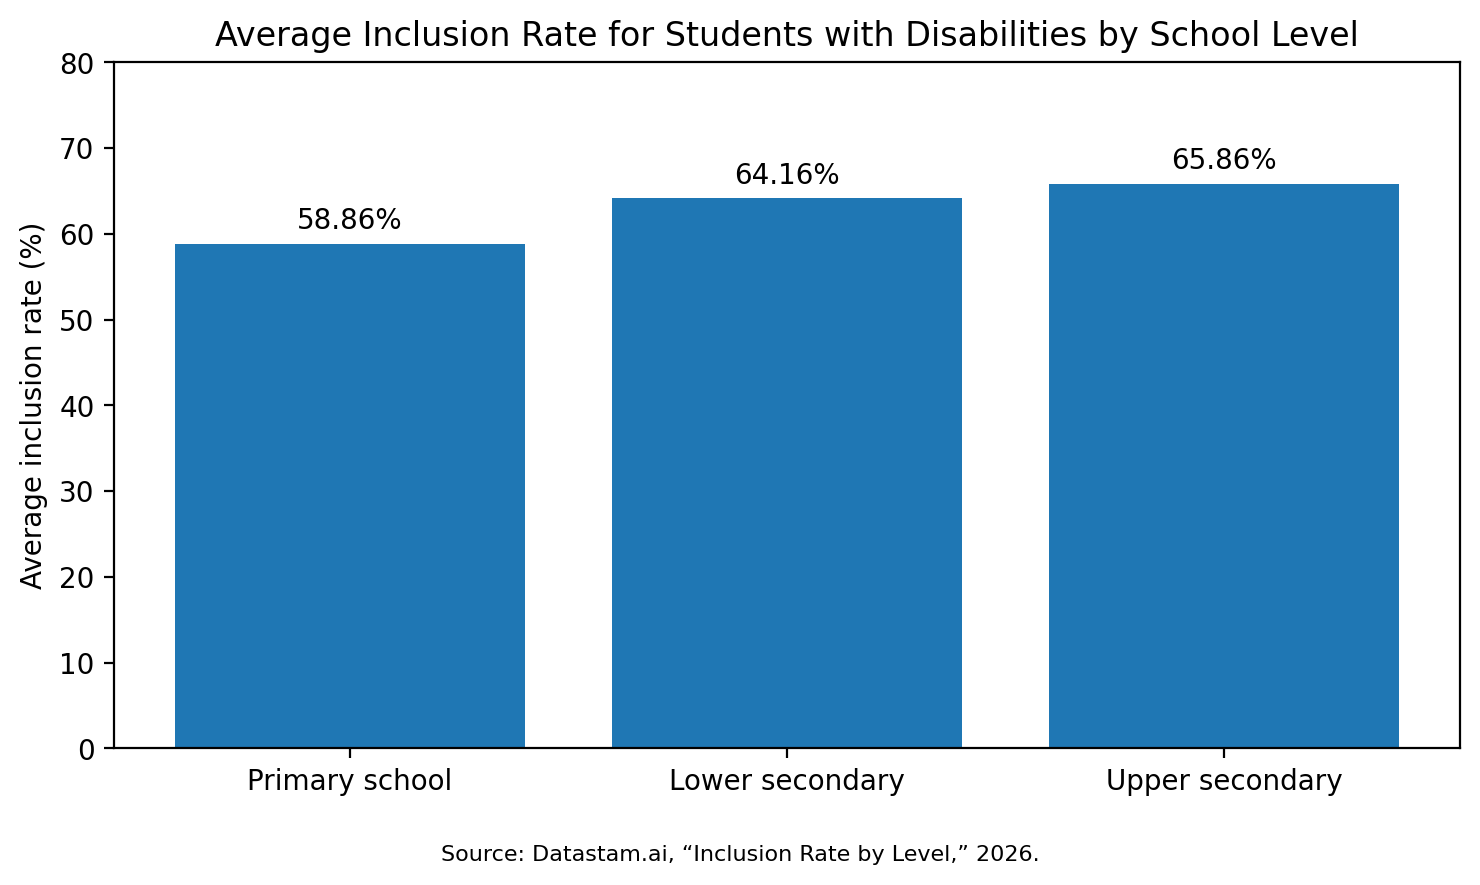
Datastam's inclusion-rate analysis reinforces this access-versus-inclusion tension. The chart shows that average inclusion rates increase by school level: 58.86 percent for primary school, 64.16 percent for lower secondary, and 65.86 percent for upper secondary (Datastam.ai 2026). At first glance, that trend suggests progress. Students with disabilities appear to be included at higher rates as they move through the education system.
But the chart also raises the deeper question this article is built around: does a higher inclusion rate mean students are fully participating, or does it only tell us where they are placed? The data is valuable because it shows a measurable pattern. It can help educators and decision-makers notice that inclusion rates differ by school level and that reported inclusion appears to increase as students progress. At the same time, the chart cannot tell us whether classroom materials are accessible, whether accommodations are implemented consistently, whether students feel stigmatized, or whether participation is meaningful.
That limitation does not weaken the chart. It clarifies how the chart should be used. The purpose of the visualization is not to prove that inclusion is solved. It is to show where formal inclusion can be seen, and then to ask what formal inclusion may still conceal.
Data is powerful because it can reveal scale. It can show that disability is not marginal. It can show where patterns appear and where systems need attention. But numbers are less effective at capturing friction: the repeated, ordinary barriers that make school harder than it needs to be for disabled students.
Friction is the confusing portal. The inaccessible PDF. The video without accurate captions. The teacher who has not been told how to implement an accommodation.
Friction is the confusing portal. The inaccessible PDF. The video without accurate captions. The teacher who has not been told how to implement an accommodation. The student who waits for enlarged materials and receives them after the test. The learning platform update that breaks a screen reader workflow. Each moment may look small from the outside. Together, they shape whether a student experiences school as a place designed with them in mind.
The same tension appears in school civil rights data. The U.S. Department of Education's Civil Rights Data Collection gathers information about students' equal access to educational opportunities and barriers to opportunity from early childhood through grade 12 (U.S. Department of Education, Office for Civil Rights 2024). This kind of public reporting matters because it moves accessibility from private anecdote into public accountability. Still, the existence of a reporting category does not guarantee that the human experience behind the category is fully visible.
Compliance matters. Legal protections matter. Documentation matters. Schools should be accountable for meeting disability rights requirements. But compliance is the floor, not the ceiling. A compliance-only mindset can narrow the question to: What are we required to provide? An inclusion mindset asks: What does the student need in order to participate with dignity?
Those two questions can lead to different systems. In a compliance-centered system, support may exist, but only after students or families identify the need, gather documentation, submit paperwork, wait for approval, notify educators, and follow up when support is not implemented. In an inclusion-centered system, many barriers are reduced before the student has to ask. Course materials are accessible by default. Videos are captioned. Documents are readable. Instructions are clear. Technology is tested with assistive tools. Flexibility is designed into the learning environment.
This does not eliminate the need for individualized accommodations. Some students will always need specific supports. But universal and inclusive design reduce the number of barriers that have to become individual battles.
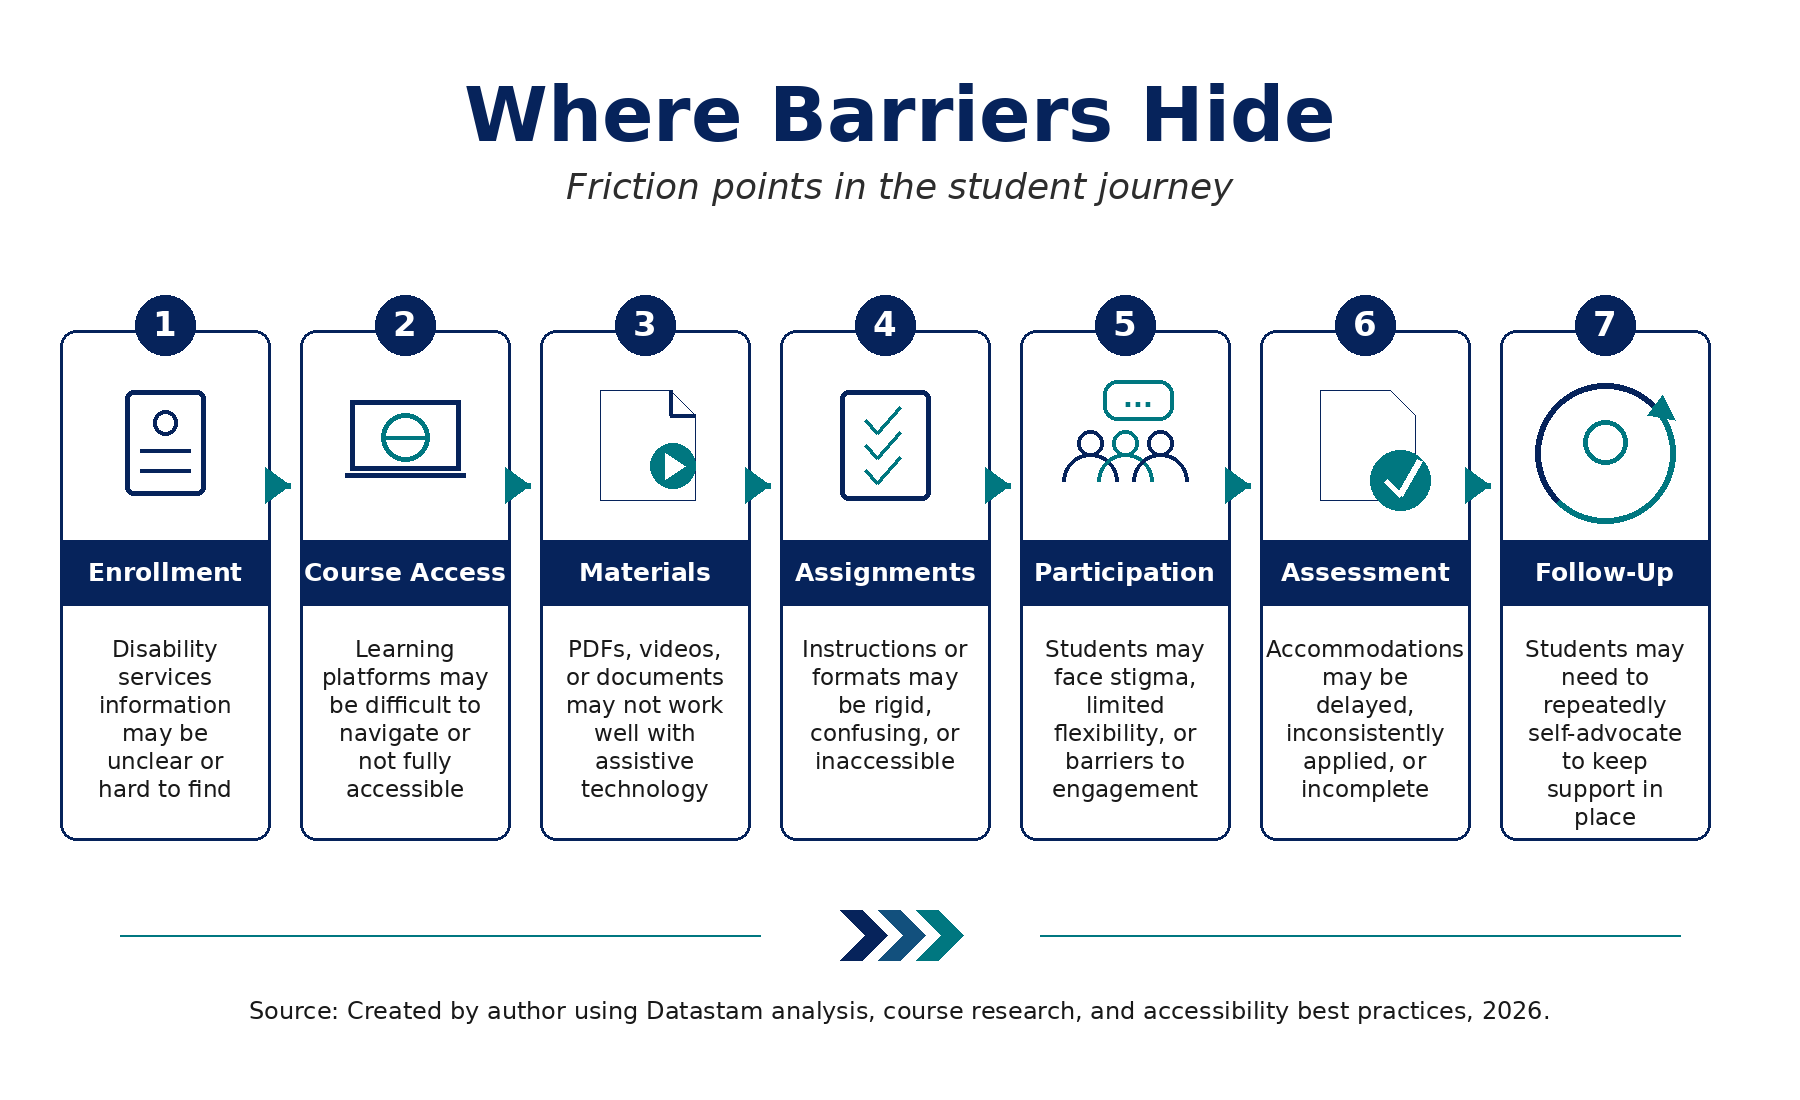
Figure 3 shows why access must be understood as a journey rather than a single event. Barriers can appear during enrollment, course access, materials, assignments, participation, assessment, and follow-up. If schools only measure whether support exists somewhere in the system, they may miss the points where students actually lose time, confidence, privacy, or opportunity.
Educators are central to this data story because accessibility does not only happen in policy offices. It happens in syllabi, slides, learning management systems, classroom discussions, assignment design, grading timelines, and everyday communication. A student's experience can change dramatically based on whether accessibility is treated as a burden or as part of good teaching.
This is especially important as more learning takes place through digital materials and data visualizations. Research on inclusive data visualization argues that people with disabilities can have difficulty creating and interacting with visualizations when existing tools are not designed accessibly, making visualization access an equity issue (Lee et al. 2021). For education, that means charts, dashboards, digital assignments, infographics, and online platforms should not be treated as neutral simply because they are available. If the visual language of education is inaccessible, then the lesson itself becomes inaccessible.
For educators, the practical recommendation is straightforward: design for access before a student has to request rescue. Use accessible document structures. Caption videos. Avoid relying on color alone to communicate meaning. Give clear instructions. Build flexibility into assignments where possible. Check whether digital materials work with assistive technology. These practices support disabled students, but they also help multilingual learners, caregivers, working students, students with temporary injuries, and students navigating stress or illness.
This story also has to be honest about what the data cannot fully show. Disability-related education data is shaped by definitions, reporting practices, disclosure patterns, and institutional processes. Some students are counted because they have formal documentation. Others may have disabilities but never disclose them. Some students may need support but avoid requesting accommodations because of stigma, confusion, cost, or previous negative experiences.
That means reported disability data may understate actual need. The absence of a student from a disability dataset does not necessarily mean the absence of disability. It may mean the student was never identified, never disclosed, never registered, or never reached the point where asking for help felt possible.
A careless story might say, The data shows how many students need accessibility support. A more responsible story says, The data shows how many students are visible within this reporting system, while acknowledging that some needs may remain unreported. That difference is not just academic. It changes how decision-makers understand responsibility.
The strongest conclusion from this story is not that schools need to care about accessibility because the law requires it, although they do. The stronger conclusion is that accessibility is one of the ways education proves whether it understands its own students.
Students with disabilities are already in classrooms, online programs, career pathways, and postsecondary institutions. The question is not whether education systems will serve disabled students. They already are. The question is whether they will serve them well.
Moving from access to inclusion requires a shift in what schools measure, what educators design, and what leaders value. Institutions should continue tracking formal access and accommodation data, but they should also look for evidence of friction. How long does support take? How clear is the process? How many students abandon a request? How often are materials inaccessible? How many barriers could be prevented through better design?
Access lets students enter the room. Inclusion asks whether the room was ready for them. And if the data story stops at the doorway, it has not told the full truth.