BEFORE YOU VOTE,

MEET YOUR NEIGHBORS
The data dismantled the story we've been telling about disability in America. The fastest-growing group isn't who you think.

The data dismantled the story we've been telling about disability in America. The fastest-growing group isn't who you think.
Jeni looks down at the ballot mailer sitting on her kitchen table. 2nd Amendment protections. Fight Against Abortion. No New Wars. Through the window, her son is climbing the steps of the summer school bus: the one he needs because he failed last year. Dyslexia. ADHD. A classroom that wasn't built for either all stole another beautiful summer day from her son.
Looking back down on the ballot... Her son isn't listed there. But the people who decide what his school can staff, what his insurance will cover, and what his future looks like are all there... hiding behind political tropes.
Jeni's son isn't an outlier. One in eight Americans lives with a disability today, and the population growing fastest isn't children or retirees. It's adults 18 to 34: people who sat in classrooms like his not long ago. What a school does with a kid who learns differently doesn't stay in that building.
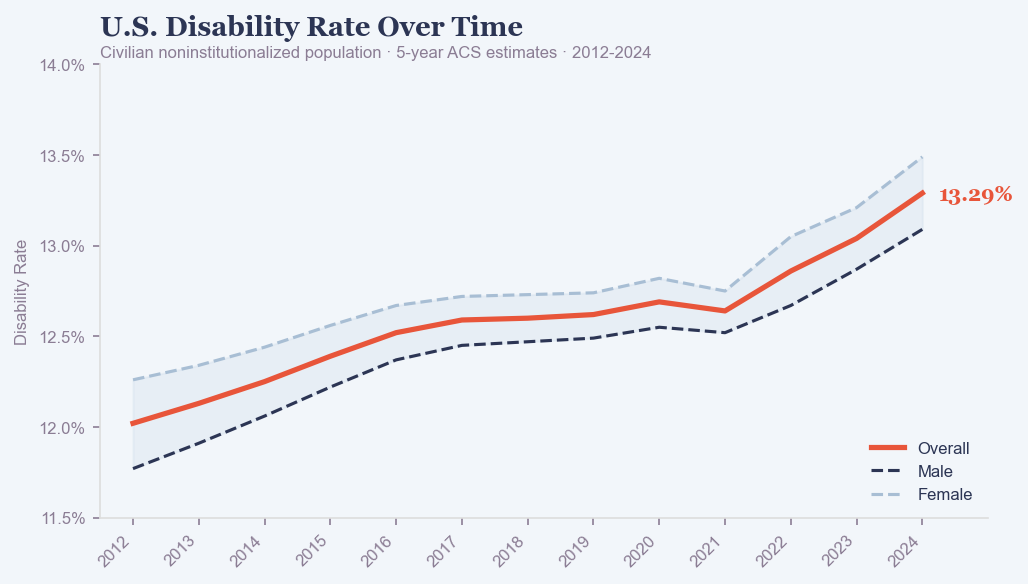
Forty-three point nine million Americans live with a disability. That number has climbed every year for over a decade: from 12.0% of the population in 2012 to 13.3% in 2024. The general population grew 8.6% in that same window. The disability count grew more than twice as fast.
None of that appeared on Jeni's mailer. It rarely does. The assumption baked into most policy conversations is that disability is an edge issue — something for specialists, advocates, and families quietly navigating it alone.
We all carry a mental image of disability that the data doesn't support anymore.
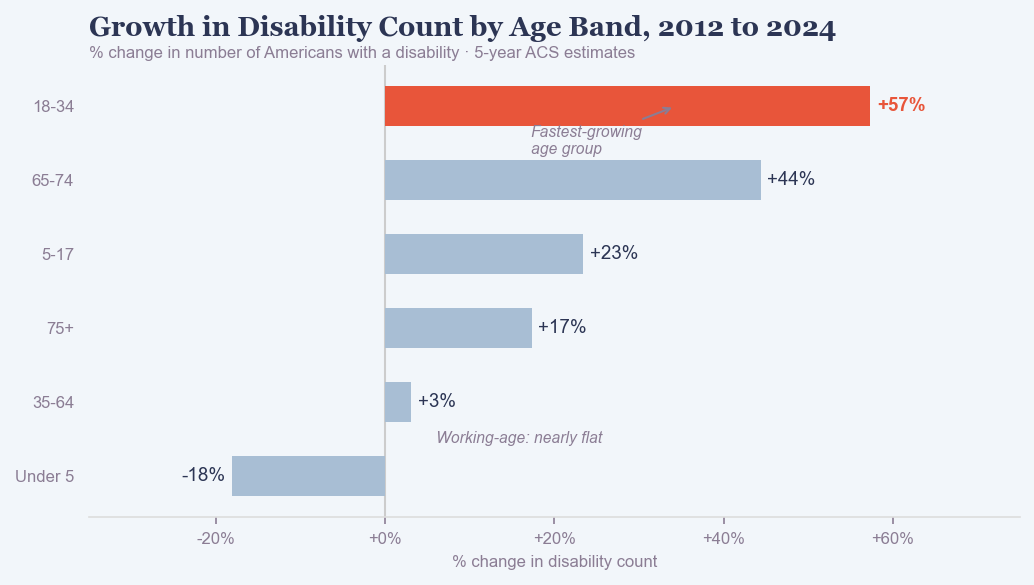
The aging population is the cause of rising disability rates, right? Nope. The fastest-growing group is adults 18 to 34: up 57% since 2012.
Let's repeat that. 57% of America: from 3.85 million in 2012 to 6.06 million in 2024. These aren't seniors aging into the count. They're people who were Jeni's son's age not long ago. The working-age band, adults 35 to 64, barely moved. Up just 3% over 12 years. The generation entering the workforce is carrying the weight.
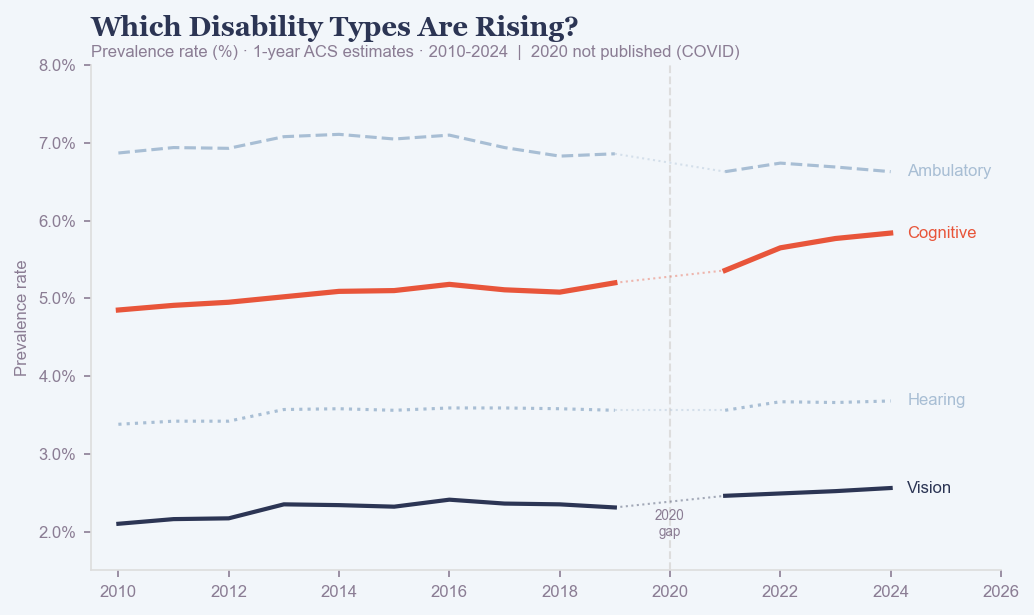
The rising disabilities affecting this growing group doesn't announce itself visually. Cognitive Disabilities affect how you read, concentrate, and process under pressure. They don't always require a wheelchair. They often require a flexible schedule, an accommodation form; or a school with the resources to actually staff one.
The age story and the type story point the same direction: ambulatory difficulty has stayed flat. What rose was cognitive difficulty, up +20%, and vision difficulty, up +22%; the disabilities of the learning and working population.
"Allowing a student with a hidden disability to struggle academically or socially when all that is needed for success is appropriate accommodations and explicit instruction is no different from failing to provide a ramp for a person in a wheelchair."
— Karen Reed, Supporting Neurodivergent Students in Case-Based Learning, Cardiff UniversityThe last decade of disability policy tells two stories. Usually only one of them makes a candidate's talking points.
The first story is good. The disabled population grew 20%. The federal health system responded: Medicaid and Medicare spending rose 163% over the same window. Disabled Americans are more likely to have health coverage today than at any point in the last decade. That is real progress.
The second story is harder to tell. In real, inflation-adjusted terms: Income Security, the floor that keeps a disabled person economically stable when they can't work, fell 13% per disabled person between 2012 and 2019. COVID emergency programs temporarily reversed the line. Then the programs ended.
The health system expanded. The income floor eroded. The policy system chose clinical coverage over economic survival.
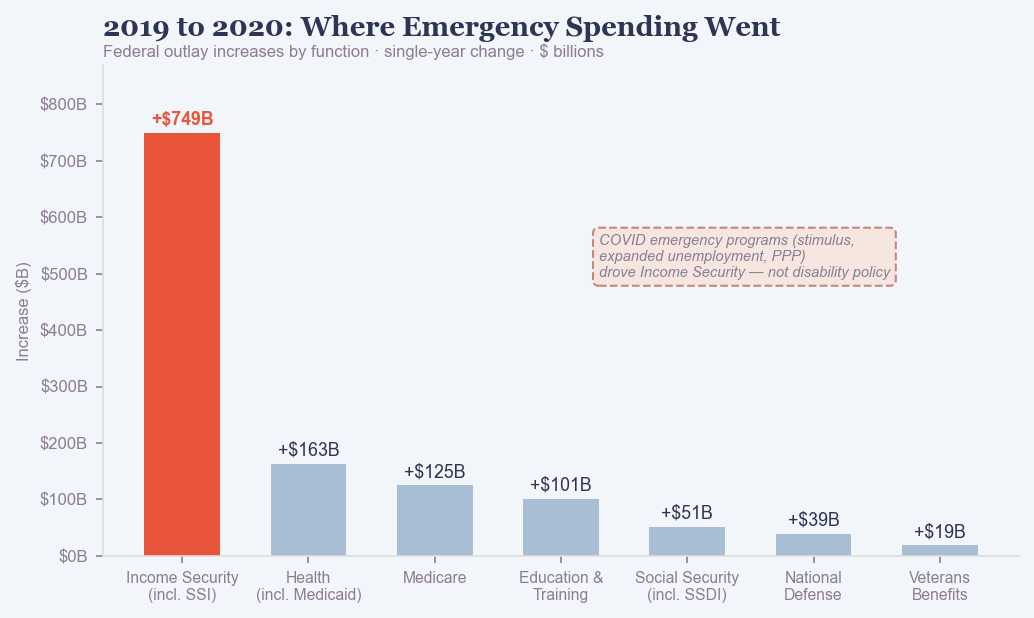
When you see the Income Security spending chart, there's a spike in 2020 that is hard to miss. It might read as the government finally catching up to a decade of rising need.
It didn't. That spike was COVID — stimulus payments, expanded unemployment, and emergency relief sent to tens of millions of Americans regardless of disability status. Emergency medicine for a broken economy. Not a policy shift for disabled people.
The chart shows exactly where the money went — and how fast it left. By 2022, spending was unwinding. The disability count kept rising.
Strip away the COVID emergency spike, and the structural story is clear: while disability was rising, the income floor was already eroding.
Between 2012 and 2019, before the emergency and before the spike, Income Security spending fell from $541 billion to $515 billion nominally. Against a decade of inflation, that's a real decline. The income floor was moving in the wrong direction before anyone declared a crisis. The emergency money came, masked the problem, and left. The disability count never followed it back down.
Jeni's son won't appear on any ballot this fall. But the people who decide what his school can staff: his IEP, his classroom aide, the therapy his insurance covers or doesn't. Those people are on it.
The system kept people like him alive. It didn't always keep them whole.
You don't have to be a policy expert to close that gap. You just have to ask.
Explore the full data behind this story at Datastam. Census tables are public and searchable at data.census.gov.

Data: U.S. Census Bureau, American Community Survey, Tables B18101 and variants (B18101A–I, B18102–B18108), 5-Year and 1-Year Estimates, 2010–2024.
Analysis and visuals: Datastam platform, 2026.
2020 gap: No standard 1-year ACS estimates were published for 2020 due to COVID-19 disruption. The gap is real — not a download error.
Spending data: OMB Table 3.2, FY2027 Budget. Budget functions are proxies — "Health" captures all Medicaid, not exclusively disability spending. Inflation-adjusted figures use CPI-U (2012 base).
Universe: Civilian, non-institutionalized population. Nursing homes, prisons, and military barracks are excluded — true prevalence is slightly higher.